Across 1,899 borrowers’ official federal loan files, the median balance is $89,549, nearly three in four owe more than they originally borrowed, and the estimated RAP payment (median $892 a month) comes in below the 10-year Standard payment (median $1,452) for two in three. This report aggregates the federal loan files (the NSLDS file each borrower downloads from StudentAid.gov) that financial advisors upload to Finology Software, with no names, firms or individual records. It describes advisor-served borrowers, a group with larger balances than the national average, who are choosing between RAP, IBR and Standard right now.
Key findings
- 1,899 borrowers, $251.7 million in open federal loans, 13,106 loans. Median balance $89,549; one in five owes $200,000 or more.
- 72.8% owe more today than the original amount of the loans they still hold. Interest has outpaced payments for most of this group.
- 39.9% of files pulled since July 4, 2025 had at least one loan on SAVE, and 45.5% had a loan in forbearance. SAVE is closed, so each of these borrowers has a plan decision to make.
- Estimated RAP payment: median $892 a month, against $1,452 on the 10-year Standard plan. RAP comes out lower than Standard for 67.1% of borrowers with an income on file.
- For 36.9%, the RAP payment is below the monthly interest. RAP waives the interest an on-time payment does not cover, so for these borrowers the balance stops growing from interest.
- 23.9% of the dollars carry an interest rate of 7% or more; the dollar-weighted average rate is 6.0%.
- 42.8% hold at least one loan made before July 1, 2014, which sets their IBR terms at 15% of discretionary income over 25 years, rather than 10% over 20.
- 21.7% have months counted toward PSLF; the median is 51 of the 120 needed, and 33 borrowers are within two years of forgiveness.
How this group compares with the national portfolio
Federal Student Aid reports $1,724.5 billion in outstanding federal student loans held by 42.3 million recipients as of June 30, 2026, about $40,800 per recipient (Federal Student Aid Portfolio Summary, fiscal year 2026, third quarter). The average balance in this report is $132,542, about 3.3 times the national figure. These are the borrowers whose plan choice moves the most dollars.
Balances
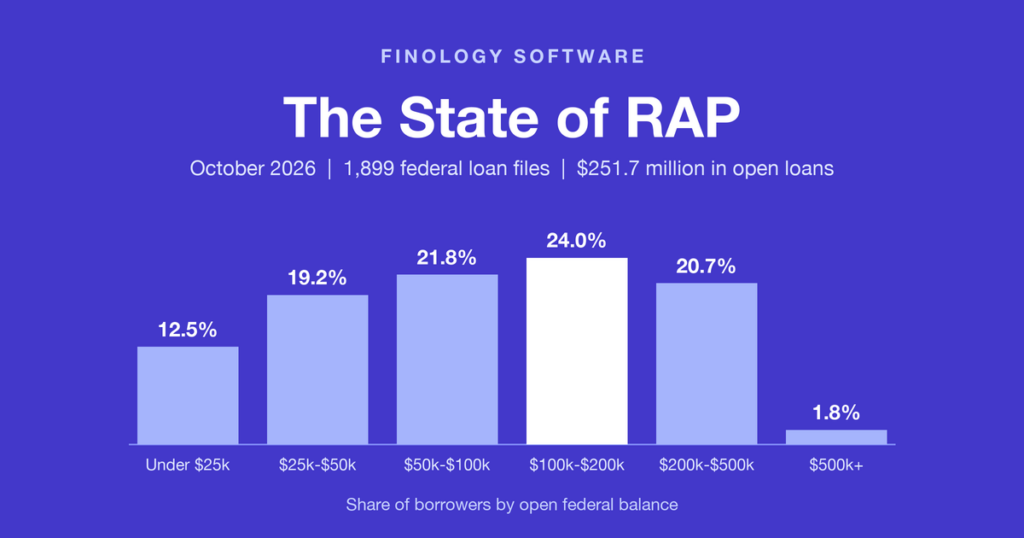
| Open federal balance | Share of borrowers |
|---|---|
| Under $25,000 | 12.5% |
| $25,000 to $50,000 | 19.2% |
| $50,000 to $100,000 | 21.8% |
| $100,000 to $200,000 | 24.0% |
| $200,000 to $500,000 | 20.7% |
| $500,000 or more | 1.8% |
Mean $132,542; median $89,549; 75th percentile $186,588; 90th percentile $308,333.
What kind of debt
| Loan type | Share of dollars |
|---|---|
| Consolidation loans | 35.9% |
| Direct Unsubsidized | 33.0% |
| Grad PLUS | 18.8% |
| Parent PLUS | 6.9% |
| Direct Subsidized | 4.1% |
| FFEL Stafford | 1.2% |
| Perkins | 0.1% |
8.8% of borrowers hold a Parent PLUS loan, which reaches income-driven repayment through consolidation.
Which plan borrowers were on
| Plan on file | Share of borrowers |
|---|---|
| SAVE | 37.3% |
| Standard | 21.9% |
| PAYE | 11.2% |
| IBR | 10.4% |
| More than one plan across their loans | 5.4% |
| Graduated | 5.1% |
| No plan on file | 3.6% |
| ICR | 3.0% |
| Extended | 1.7% |
RAP itself, REPAYE and other plans each had fewer than 10 borrowers and are not shown. 2.5% had a loan in default.
RAP against Standard
| Plan | Median monthly payment |
|---|---|
| RAP (estimated) | $892 |
| 10-year Standard | $1,452 |
Median household income entered: $110,000; 60 of the 425 file jointly with a spouse. RAP is lower than the 10-year Standard payment for 67.1% of these borrowers, and below the monthly interest for 36.9%. To run the same comparison for one borrower, use the free RAP payment calculator; for how RAP payments count toward forgiveness, see RAP and PSLF.
Method
- Source: each borrower’s most recent federal loan file in Finology Software, uploaded between November 2, 2022 and October 7, 2026. Balances are as of each file’s date. Plan and status figures use only files pulled after the One Big Beautiful Bill Act was signed (July 4, 2025).
- Who is counted: open loans from uploaded federal loan files. Hand-entered loans, sample and demo accounts, and internal test accounts are excluded, and a borrower held by two firms is counted once.
- RAP estimate: the RAP formula in the Finology Software engine (1% to 10% of AGI by $10,000 band, minus $50 a month per dependent, $10 minimum), using the income the advisor entered as AGI and combined income for joint filers. Entered income is not always the tax-return AGI, so treat it as an estimate. The same formula runs in the free calculator: a single filer with $110,000 of AGI and no dependents gets $917 a month.
- Standard: a 10-year level payment at each borrower’s dollar-weighted interest rate.
- Privacy: no name, email, address, birth date or loan ID leaves the database query; only totals are kept; any group under 10 borrowers is suppressed.
Download the data and cite this report
Download the aggregates (CSV). Every figure in this report, one row per metric, with its unit and base.
How to cite: Finology Software, The State of RAP, October 2026, https://finology.tech/state-of-rap-2026/
Put your plan where you can see it
Add your loans and your plan in a free borrower account. See your payoff date, watch your progress, and know exactly what an extra $50 a month changes.